Here is part 2 of data visualization done during the early days (for part 1 click here).
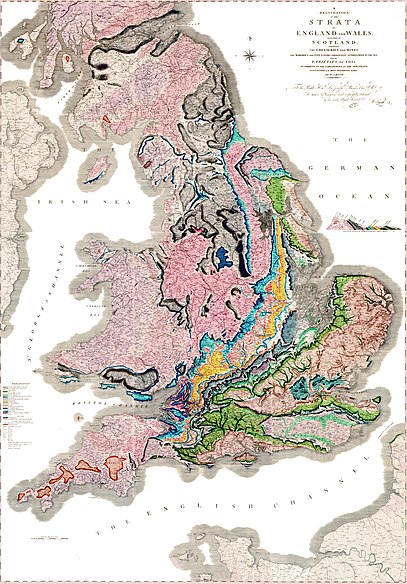 Geologist William Smith drew his first sketch of the 1815 geological map of Great Britain, which many cartographers even today refer to as “The Map that Changed the World”. And yes, it was hand drawn.
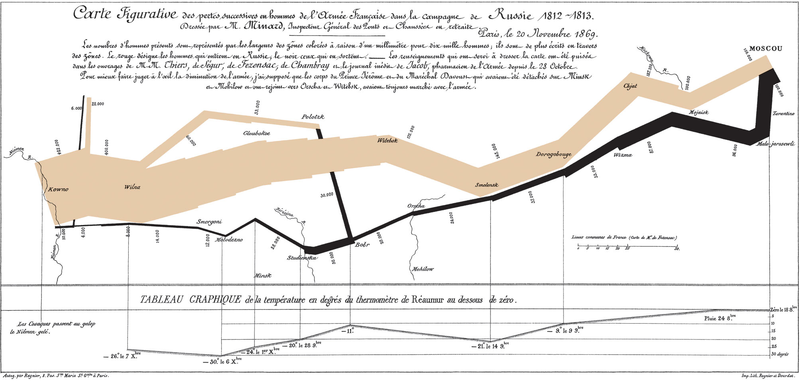
Above is a chart drawn by Charles Minard in the year1869 illustrating the death of Napoleon’s army during the 1812 Russian campaign.
The best reference for further reading is the following: http://datavis.ca/milestones/
Above is a chart drawn by Charles Minard in the year1869 illustrating the death of Napoleon’s army during the 1812 Russian campaign.
The best reference for further reading is the following: http://datavis.ca/milestones/
Comments
Post a Comment