Data analytics is a complex subject that can mean many things to the experts. Data analytics strategy is time consuming to conceptualize, design and then to implement. Once a solution is in place many "lay people" are still left with an eneasy feeling since the output ends up either in the format of number centric tables or slightly more visually appealing charts but which are still hard to understand and to use.
"Data Milling" is a new term introduced by the authors (Ulla Gain & Virpi Hotti) in the paper titled "Big Data Analytics for Professionals, Data-milling for Laypeople". Simply put, it is a technique for analyzing big data for text phrases that shed light on the bigger picture. This approach presents the reader with a format (text phrases) that actually means something to them. The authors then go on to explain that the text phrases or "nuggets" can be used to better define the problem and can also be used to introduce to the reader new avenues and angles that might be ignored otherwise.
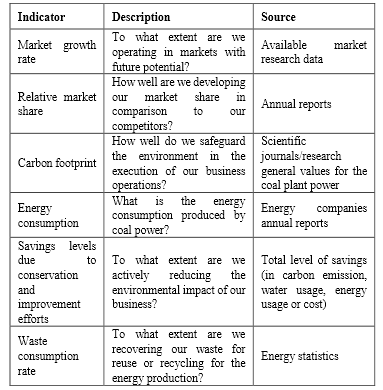
The authors also present an example of how this could be applied to the field of coal power plants in Europe. (Wish they had chosen a slightly more relevant example for most of us.) I like the simplicity of the idea of data milling but feel a lot of work needs to be done to make it more automated and friendly before the lay people that it is meant for will accept it.
For the interested user, for more details follow this link.
"Data Milling" is a new term introduced by the authors (Ulla Gain & Virpi Hotti) in the paper titled "Big Data Analytics for Professionals, Data-milling for Laypeople". Simply put, it is a technique for analyzing big data for text phrases that shed light on the bigger picture. This approach presents the reader with a format (text phrases) that actually means something to them. The authors then go on to explain that the text phrases or "nuggets" can be used to better define the problem and can also be used to introduce to the reader new avenues and angles that might be ignored otherwise.
The authors also present an example of how this could be applied to the field of coal power plants in Europe. (Wish they had chosen a slightly more relevant example for most of us.) I like the simplicity of the idea of data milling but feel a lot of work needs to be done to make it more automated and friendly before the lay people that it is meant for will accept it.
 |
| Data Milling applied to research on setting up a new power plant |
For the interested user, for more details follow this link.